INFORMATION
GENERAL INFORMATION
The 2010 general election was held on Thursday 6th May 2010, in which a total of 45,597,461 of the UK population voted (a 65.1% voter turnout), under the first-past-the-post system.
MAJORITY
None of the political parties managed to achieve the 326 seats needed for an overall majority, which resulted in a hung parliament. The Conservative party attracted the largest amount of votes, but was twenty seats short of the target number.
COALITION
As a result of the hung parliament, the Conservatives and Liberal Democrats announced a coalition deal on the 12th May - "Cameron Ministry" - the cabinet of which was made up of 16 Conservatives and 5 Liberal Democrat MPs. It was the first coalition government to have governed the UK since the Churchill War Ministry of the Second World War.
PARTY LEADERS
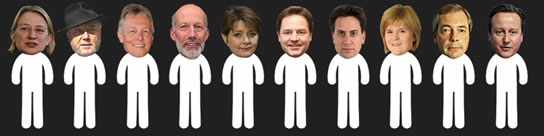
The three main party leaders at the UK general election 2010 were David Cameron (Conservative), Gordon Brown (Labour) and Nick Clegg (Liberal Democrat).
SWINGS
Conservative: 3.7% 
Labour: 6.2% 
Liberal Democrat: 1.0%
OPINION POLLS
After the 2005 general election, Labour enjoyed a double-digit lead in most of the popular opinion polls, but their generous lead soon eroded, and by the end of 2005 the Conservative party showed a small but significant lead in the opinion polls, especially once David Cameron had been elected as party leader.
The following year saw leads for both the Labour and Conservative parties alternatively, and in 2007 after leader Tony Blair resigned and Gordon Brown appointed as their new leader, Labour were once again enjoying a lead in the polls. However, in subsequent months and years the Conservatives once again took the lead, especially after the MP's expenses scandals.
At the start of 2010 the main polls (YouGov, ComRes, Ipsos MORI and ICM) all showed that the Conservative lead had dwindled enough to speculate that a hung parliament could occur.
The exit poll results were announced on election day, and once again suggested a hung parliament, suggesting that the Conservative party would be 21 seats short of a controlling majority.